• Home
  • Our Strategy
    • Academics Behind the Portfolios
  • Investor Overview
    • Why We Are Different
  • Work With Eric

We believe that investing isn't just for those who are already wealthy, but for anyone eager to create wealth and pursue their American Dream.

Independent Financial Advisors Anchorage Alaska

  • Videos
  • Investor Workshops
  • Call Today 907-258-2888

The Stock-Bond Decision

May 11, 2011 by Eric

Choosing a basic stock-bond mix is an important first step in portfolio design. Although the decision may appear simple, it can have a profound impact on your wealth.

Portfolio theory explains the value of making a deliberate, strategic decision about the proportion of stocks versus bonds to hold in a portfolio. This decision has roots in the “separation theorem,” which was proposed by Nobel laureate James Tobin in the late 1950s.1 The separation theorem proposes that all investors face two important decisions: (1) deciding how much risk to take, and then (2) forming a portfolio of “risky” assets (equities) and “less risky” assets (fixed income) to achieve this risk exposure.

Your stock-bond decision implements this risk position.

The Rationale
The theorem proposes that all investors who are willing to take stock risk should begin with a diversified market portfolio. Each investor then can dial down total risk in the portfolio by adding fixed income to the mix. The greater the bond allocation relative to stocks, the less risky the portfolio and the lower the total expected return; the greater the stock allocation relative to bonds, the higher the portfolio’s expected return and risk.

Investors who want to take even more risk than the market can increase exposure through borrowing on margin and/or tilting the stock portfolio toward asset groups that offer higher expected returns for higher risk.

So, how does one confidently allocate between stocks and bonds? A common method is to evaluate model portfolios along the risk-return spectrum. A riskier portfolio holds 100% stocks, and the least volatile portfolio holds 100% bonds. Between these extremes lie standard stock-bond allocations, such as 80%-20%, 60%-40%, 40%-60%, and 20%-80%.2 Then you compare the average annualized return and volatility (standard deviation) of each model portfolio for different periods, such as one, three, five, ten, and twenty years. Volatility is one of several risk measures investors may want to consider. With this in mind, the analysis should feature average returns, as well as best- and worst-case returns for the various periods.

While this technique relies on historical performance that may not repeat in the future, and does not consider various investment costs, it may help you think about the risk-return tradeoff and visualize the range of potential outcomes based on the aggressiveness of your strategy.

Refining Your Stock Allocation
After establishing the basic stock-bond mix, investors turn their attention to refining the stock allocation, which is where the best opportunities to refine the risk-return tradeoff are found. Investors who are comfortable with higher doses of equity risk can overweight or “tilt” their allocation toward riskier asset classes that have a history of offering average returns above the market. Research published by Eugene Fama and Kenneth French found that small cap stocks have had higher average returns than large cap stocks, and value stocks have had higher average returns than growth stocks. By holding a larger portion of small cap and value stocks in a portfolio, an investor increases the potential to earn higher returns for the additional risk taken.

The final step in refining the stock component is to diversify globally. By holding an array of equity asset classes across domestic and international markets, investors can reduce the impact of underperformance in a single market or region of the world. Although the markets may experience varying levels of return correlation, this diversification can further reduce volatility in a portfolio, which translates into higher compounded returns over time.

Fixed Income Strategies
Research shows that two risk factors—maturity and credit quality—account for most of the average return differences in diversified bond portfolios. Long-term bonds and lower-quality corporate bonds typically offer higher average yields to compensate investors for taking more risk. But keep in mind that these premiums are considerably lower than the market, size, and value premiums documented in the equity world.

Investors generally hold fixed income to either (1) reduce overall portfolio volatility, or (2) generate a reliable income stream. These objectives typically lead to different investment decisions. The first approach, volatility reduction, is an application of separation theorem (i.e., hold equities for higher return and use fixed income to temper portfolio volatility). Rather than increasing risk to maximize yield, these investors want to hold fixed income securities that are lower risk. Certain fixed income asset groups are better suited for this strategy.

With this in mind, some long-term investors may seek to earn higher expected returns by shifting risk to the equity side of their portfolio. With an eye to minimize maturity and credit risk, they hold short-term, high-quality debt instruments that have historically offered lower yields with much lower volatility.

The second purpose for holding bonds is to generate reliable cash flow. Income-oriented investors, including retirees, pension plans, and endowments, may not worry as much about short-term volatility in their bond portfolio. Their priority is to meet a specific funding obligation in the future. Consequently, they design a portfolio around bonds and accept more volatility in hope of earning higher yields, which they pursue by holding bonds with longer maturities and/or lower credit quality.

Whether investing for total long-term return or for income, a portfolio should be diversified across issues and global markets to avoid uncompensated risk from specific issuers and to capture differences in yield curves around the world.

Summary
The stock-bond decision drives a large part of your portfolio’s long-term performance. During portfolio design, evaluating different stock-bond combinations can help you visualize the risk-return tradeoff as you consider the range of potential outcomes over time. Once you determine a mix, it can guide more detailed choices of asset classes to hold in the portfolio. And as your appetite for risk shifts over time, you can revisit the mix to estimate how shifting your portfolio mix may impact your wealth accumulation goals in the future.

Endnotes
1 James Tobin, “Liquidity Preference as Behavior Towards Risk,” The Review of Economic Studies 25, no. 2 (February 1958): 65-86.

2 The basic stock component may be reflected by the S&P 500 Index, or preferably, by a broader market proxy, such as the CRSP 1-10 Index. The CRSP 1-10 Index is a market capitalization weighted index of all stocks listed on the NYSE, Amex, NASDAQ, and NYSE Arca exchanges. The S&P 500 Index offers a proxy of the large cap US equities market. The fixed income component may be represented by an index of short-term US government securities or government and corporate bonds.

The information presented above was prepared by Dimensional Fund Advisors, a non-affiliated third party.

Disclosures
Stock is the capital raised by a corporation through the issue of shares entitling holders to an ownership interest of the corporation. A bond is a loan that an investor makes to a corporation, government, federal agency, or other organization. Also known as debt or fixed income securities, most types of bonds pay interest based on a regular, predetermined coupon rate that is set when the bond is issued.

Although investors may form their expectations from the past, there is no assurance that future investment results will model historical performance.

Indexes are not available for direct investment. Their performance does not reflect the expenses associated with the management of an actual portfolio. Past performance is not a guarantee of future results.

Stocks offer a higher potential return as compensation for bearing higher risk. However, this premium is not a certainty and investors should not expect to consistently receive higher returns from stocks. In fact, market history shows extended periods when stocks did not outperform bonds.

Diversification neither assures a profit nor guarantees against loss in a declining market.

A bond portfolio designed for income also carries significant risks, including default and term risk, call risk, and purchasing power (inflation) risk. Foreign securities also are exposed to currency movements.
Filed Under: Articles

What Every Investor Should Know About Mutual Funds

May 11, 2011 by Eric

Proponents of active management believe that skilled managers can outperform the financial markets through security selection, market timing, and other efforts based on prediction. While the promise of above-market returns is alluring, investors must face the reality that as a group, US-based active managers do not consistently deliver on this promise, according to research provided by Standard & Poor’s.

S&P Indices publishes a semi-annual scorecard that compares the performance of actively managed mutual funds to S&P benchmarks. Known as the SPIVA scorecard1, the report analyzes the returns of US-based equity and fixed income managers investing in the US, international, and emerging markets. The managers’ returns come from the CRSP Survivor-Bias-Free US Mutual Fund Database, and the managers are grouped according to their Lipper style categories.2

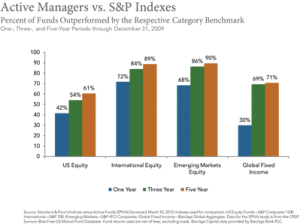
The graph below features fund categories from the most recent SPIVA scorecard—all US equity funds, international funds, emerging market funds, and global fixed income funds—and shows the percentage of active managers that were outperformed by the respective S&P Indices in one-, three-, and five-year periods. These are only four of thirty-five equity and fixed income fund categories. But a deeper analysis confirms that the active manager universe usually fails to beat the market benchmarks over longer time horizons. Underperformance of active strategies is particularly strong in the international and emerging markets, where trading costs and other market frictions tend to be higher.

Over the last five years, about 60% of actively managed large cap US equity funds have failed to beat the S&P 500; 77% of mid cap funds have failed to beat the S&P 400; and two-thirds of the small cap manager universe have failed to outperform the S&P Small Cap 600 Index. Furthermore, across the thirteen fixed income fund categories, all but one experienced at least a 70% rate of underperformance over five years.

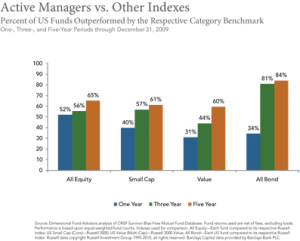
In 2009, active funds experienced more success over a one-year period, and proponents typically highlight those results in the SPIVA scorecard. However, one-year results are not consistently strong from year to year, and investors should not draw conclusions from short-term results. Over three- and five-year periods, most fund categories have not outperformed their respective benchmarks.

This poor track record appears in other research, as indicated in the graph below. This study compared the same actively managed funds in the CRSP database to the Russell benchmarks and showed similar results over the three- and five-year periods. Over the past five years, about 65% of all US equity managers failed to outperform their respective Russell Indexes, and 84% of fixed income managers failed to beat their respective Barclays Capital Indices.

Of course, the results of these studies will fluctuate over time, and a majority of funds in a given category might outperform over the short term. But the message is clear: As a group, actively managed funds often struggle to add value relative to an appropriate benchmark—and the longer the time horizon, the greater the challenge for active managers to maintain a winning track record.

1. SPIVA stands for Standard & Poor’s Indices versus Active Funds. The report covers US equity, international equity, and fixed income categories. The actively managed funds are grouped according to Lipper style categories.

2. The Center for Research in Security Prices (CRSP), at the University of Chicago Booth School of Business (Chicago GSB), is a nonprofit center that also functions as a vendor of historical data. CRSP end-of-day historical data covers roughly 26,500 stocks listed on the NYSE, Amex, and NASDAQ exchanges. The Survivor-Bias-Free US Mutual Fund Database includes a history of each US mutual fund’s name, investment style, fee structure, holdings, asset allocation, and monthly data, including total returns, total net assets, net asset values, and dividends. All data items are for publicly traded open-end mutual funds and begin at varying times between 1962 and 2008, depending on availability. The database is updated quarterly and distributed with a monthly lag.

Past performance is no guarantee of future results. This article is provided for informational purposes only and should not be construed as an offer, solicitation, or a recommendation from Dimensional Fund Advisors.
Dimensional Fund Advisors is an investment advisor registered with the Securities and Exchange Commission.
©2010 Dimensional Fund Advisors

Filed Under: Articles

Economics 101: Learning From Sweden’s Free Market Renaissance

May 11, 2011 by Eric

Sweden is a powerful example of the importance of public policy. The Nordic nation became rich between 1870 and 1970 when government was very small, but then began to stagnate as welfare state policies were implemented in the 1970s and 1980s. The CF&P Foundation video explains that Sweden is now shifting back to economic freedom in hopes of undoing the damage caused by an excessive welfare state.

Filed Under: Videos

10 Investment Related Resolutions

May 11, 2011 by Eric

1. I will not confuse entertainment with advice. I will acknowledge that the financial media is in the entertainment business and their message can compromise my long-term focus and discipline, leading me to make poor investment decisions.

2. I will stop searching for tomorrow’s star money manager, as there are no gurus. Capitalism will be my guru because with capitalism there is a positive expected return on capital, and it is there for the taking. And for me to succeed, someone else doesn’t have to fail.

3. I will not invest based on a forecast—whether it is mine or anyone else’s. I will recognize that the urge to form an opinion will never go away, but I won’t act on it because no one can repeatedly predict the future. It is, by definition, uncertain.

4. I will keep a long-term perspective and appropriately consider my investment horizon (i.e., how long my portfolio is to be invested) when determining my performance horizon (i.e., the time frame I use to evaluate results).

5. I will continue to invest new capital and work my plan because it is time in the market—and not timing the market—that matters.

6. I will adhere to my plan and continue to rebalance (i.e., systematically buying more of what hasn’t done well recently) rather than “unbalance” (i.e., buying more of what’s hot).

7. I will not focus my portfolio in a few securities, or even a few asset classes, as diversification remains the closest thing to a free lunch.

8. I will ensure my portfolio is appropriate for my goals and objectives while only taking risks worth taking.

9. I will manage my emotions by learning about and acknowledging the biases and cognitive errors that influence my behavior.

10. I will keep my cost of investing reasonable.
Most of us find it hard to follow a sensible diet or a sensible investment strategy 100% of the time. If you must stray when managing your wealth or well-being, moderation is the key. Chocolate cake is OK, as long as it’s not for dinner every night. Speculating on a stock or two is all right as well, as long as you don’t do it with your investment capital.
Finally, just as successful athletes rely on coaches and trainers to help them achieve their goals, most investors can probably benefit from having a “financial coach” to remind them about their New Year’s resolutions and keep them on track toward a more prosperous future.

From: Northern Exposure – Be It Resolved by Brad Steiman, Vice President DFA, January 2011

Filed Under: Articles

Power of Free Markets by Milton Friedman: The Pencil

May 11, 2011 by Eric

The power of free markets by Milton Friedman. He was a recipient of the Nobel Memorial Prize in Economic Sciences.

Filed Under: Videos

Welcome

May 11, 2011 by Eric

We believe that financial markets are efficient and will teach this concept as the basis of management of your investment portfolios. As such, we will refrain from recommending strategies that involve any variations of stock picking, market timing, or reliance on past performance of an investment.

We will help you navigate through the “fog” of investing, working within your family to help you maximize your personal financial resources, alleviate your financial and retirement concerns, and simplify the administration of your affairs. Our services are designed to coach you to achieve peace of mind with your investing.

We vow to take the time necessary to listen and provide the professional guidance needed to help you maintain the course toward the attainment of your goals and the expression of your “True Purpose for Money” even in the most difficult of economic times.

As a fully independent financial advisor, we are not restricted to any investment product or service, and work exclusively for the benefit of our clients. In fact, as a registered investment advisor, we have a legal fiduciary obligation to act in each client’s best interests. We care deeply about helping our investors achieve their goals and objectives, and endeavor to provide them with the highest-quality service and guidance.

Filed Under: Articles

  • « Previous Page
  • 1
  • 2
  • 3

Copyright © 2025 · Metro Pro Theme on Genesis Framework · WordPress · Log in